In my earlier blog post, we learnt about the full tech-stack upgrade of the Process Viewer and how this code rewrite from scratch has enabled us to make significant amount of user experience changes and introduce tons of minor enhancements. Today, I take this opportunity to unveil the Process KPI Panel feature that will provide intelligent analytics to the user within the context of the Process Viewer.
Before we go further, if your license includes Analytics, then remember that you can access the most comprehensive process intelligence reports using the canned reports, shipped with the product and even create your own reports and dashboards via point and click.
Now getting back, to access the Process KPI panel, you need to activate this feature from Settings –> Work Center by enabling the property name “Show Process KPI“.
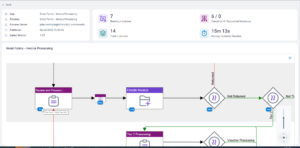
Once enabled, you will now observe an action button on the top menu of the Process Viewer to open the process KPI panel. Once that button is clicked you can see a panel similar to one shown below

The Process KPI panel provides statistical operational information about the version of the process this process instance belongs to. This includes number of live running instances, total instances that have been created, number of cancelled and suspended process instances along with average process execution time for the process which is based on the total number of times this version of process has been instantiated. You would also be able to see the average execution time take by individual activities for this version of the process.
The use case driving this feature originated from a couple of our customers who wanted insights on the completion time taken by approval apps inline within the Process Viewer itself rather than having to go to Analytics Center. While we have made a good start in delivering actionable insights on the Process Viewer, our team does have some thoughts on taking this to next level which you will see in future releases.
